
Helping communities and organizations work better.

Portfolio

I like giving real examples. Here is just some of the work I have completed over the years.

Leadership Experience

12+ Years

Coaching Experience

15+ Years

Youth Athletes Coached

1000+

Teaching Experience

8+ Years

It's a perfect match

INTERESTED IN WORKING TOGETHER?

This is my digital marketing portfolio, and I built it around screenshots instead of claims. Every number on this page comes straight out of the ad platform or analytics account it was pulled from, and the screenshot sits right under it so you can check me. Most of this work is recent and spans three very different jobs: a fantasy sports app I built myself, a city council campaign on a budget under $1,000, and the career college where I have run marketing since 2016.

I am not a developer and I am not a designer. I am the person who sets up the tracking, writes the ads, reads the numbers every morning, and turns things off when they are not working. That is what a digital marketing portfolio should show, and that is what you are looking at below.

Reddit ads for The Trade Analyzer: a 15.11% click-through rate

The Trade Analyzer is a fantasy sports tool I built end to end with Claude Code, without being a software developer. It scores proposed trades across the NHL, NFL and MLB, and it is live with paid subscriptions. When it came time to find users, Reddit was the obvious place, because that is where fantasy managers argue about trades all day.

I ran the campaign myself. It delivered 50,265 impressions and 7,595 clicks for a 15.11% click-through rate at a cost per click of CA$0.08. The Reddit reps asked me what I was doing to get that number.

"That's the highest CTR I've ever seen for a new client."
15.11%Click-through rateReddit Ads, The Trade Analyzer
CA$0.08Cost per click
7,595Clicks
50,265Impressions
CA$11.96eCPM
Reddit Ads dashboard for The Trade Analyzer showing 50,265 impressions, 7,595 clicks, CA$0.08 CPC and a 15.11% CTR, from Justin Chapman's digital marketing portfolio
Reddit Ads campaign summary for The Trade Analyzer.

What happened after I turned the ads off

The ads lifted new users the week they went live, which is what ads are supposed to do. The part I care more about is the right side of this chart. I turned the ads off on September 22. New users kept climbing anyway, and returning users climbed with them. That is the difference between buying traffic and building something people come back to.
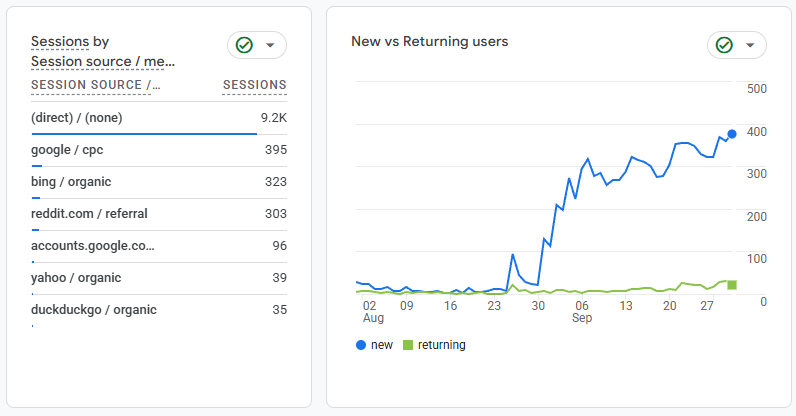
Google Analytics chart of new versus returning users for The Trade Analyzer, August to September, showing new users rising from under 50 a day to around 400 a day after the Reddit ads and continuing to climb after the ads stopped
New versus returning users, Google Analytics. New users went from under 50 a day in early August to roughly 400 a day by the end of September. The Reddit ads were turned off on September 22; the line keeps rising after that.
Horizontal bar chart of Trade Analyzer sessions by source: direct 9.2K, Google cpc 395, Bing organic 323, Reddit referral 303, accounts.google.com 96, Yahoo 39, DuckDuckGo 35 Trade Analyzer sessions by source Google Analytics, Aug 2 to Sep 30 (dates as shown in the GA4 screenshot) (direct) / (none) 9.2K google / cpc 395 bing / organic 323 reddit.com / referral 303 accounts.google.com 96 yahoo / organic 39 duckduckgo / organic 35
Sessions by source over the same period. Reddit referral traffic is highlighted. Direct traffic is the largest bucket by a wide margin, which is typical for an app people bookmark and return to.

Running for West Kelowna City Council on under $1,000

In 2026 I ran for West Kelowna City Council. I built the website, wrote the ads and ran them myself, the same way I did for the Stephen Johnson federal campaign in 2024. The entire advertising budget was under $1,000 and all of it went to Meta.

The average cost per click came in at $0.26. Across the campaign, the ads reached the equivalent of every person in West Kelowna 2.4 times. Small budgets are not the problem most campaigns think they are. Vague targeting and a landing page that does not match the ad are the problem.

$0.26Average cost per clickMeta ads, West Kelowna council campaign
2.4xReach versus West Kelowna's populationEquivalent to reaching every resident 2.4 times
Under $1,000Total ad budget

What the campaign website did

The site went from a few dozen visitors a day to a peak of over 900. Compared with the previous period, active users were up 904.7% to 5.5K, new users were up 889.8% to 5.4K, and views were up 804.5% to 11K. That is a simple campaign doing its job: the ads and the landing page were built together, so people who clicked found what they were promised.
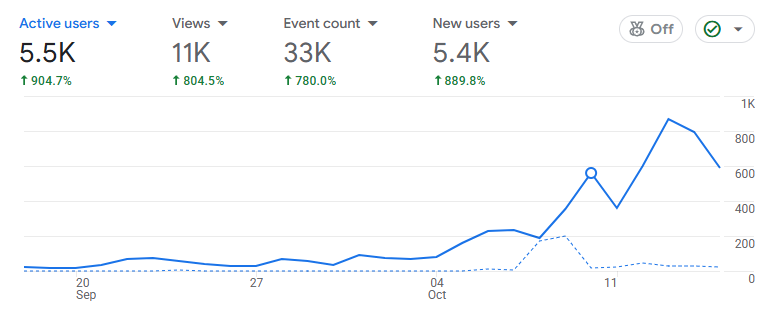
Bar chart of campaign website growth versus the previous period: active users up 904.7% to 5.5K, new users up 889.8% to 5.4K, views up 804.5% to 11K, event count up 780% to 33K Campaign website growth versus the previous period Google Analytics, Sep 16 to Oct 15 compared with the period before 0% Active users +904.7% (5.5K) New users +889.8% (5.4K) Views +804.5% (11K) Event count +780.0% (33K)
Campaign website growth versus the previous period, Google Analytics. Bars show percentage change, with the period total in brackets.
Google Analytics overview for the West Kelowna council campaign website showing 5.5K active users up 904.7%, 11K views up 804.5%, 33K events up 780% and 5.4K new users up 889.8%
Google Analytics for the campaign website, Sep 16 to Oct 15.

What the campaign's social media did

Between September 18 and October 15 the campaign Facebook page pulled 41,363 views. Ads accounted for 24,073 of those and organic reach for 17,290, and the organic number was a 630.5% increase on the previous period. Content interactions were up 320.8% to 425. The ads did their share, but more than four in ten views came from people sharing and commenting on their own.

Bar chart of campaign Facebook views by source: 24,073 from ads and 17,290 from organic, out of 41,363 total Where the Facebook views came from Meta, Sep 18 to Oct 15. 41,363 total views From ads 24,073 (58.2%) From organic 17,290 (41.8%)
Facebook views by source for the campaign page, Sep 18 to Oct 15. The two sources add up to the 41,363 total.
Bar chart of campaign Facebook page growth: views up 1,600% to 41.4K, organic views up 630.5% to 17,290, content interactions up 320.8% to 425, 3-second views up 100% to 1.9K, watch time up 100% to 8 hours 58 minutes Campaign Facebook page versus the previous period Meta, Sep 18 to Oct 15 0% Views +1,600% (41.4K) Organic views +630.5% (17,290) Content interactions +320.8% (425) 3-second video views +100% (1.9K) Watch time +100% (8h 58m)
Campaign Facebook page metrics versus the previous period, Meta. Watch time and 3-second views each roughly doubled.
Meta content overview for Justin Chapman's council campaign page showing 41.4K views, 1.9K 3-second views, 425 content interactions, 8 hours 58 minutes of watch time, and a views breakdown of 17,290 organic and 24,073 from ads
Meta content overview for the campaign page, Sep 18 to Oct 15, with the top posts by views.

Taking over CanScribe's Google Ads from an agency

I had been running CanScribe Career College's Google Ads myself since January 2026. From May to July a marketing agency took over the account. In August I took it back and rebuilt it around one campaign, All Programs Search. The comparison below is the agency's main campaign over its three months against mine from August to mid-October, straight out of the Google Ads campaign table. Mine has had about two and a half months, so it is working with less time, not more.

Cost per conversion dropped from CA$46.98 to CA$34.13, a 27.4% reduction. Average cost per click fell from CA$4.70 to CA$3.27. Invalid clicks dropped from 427 to 170. Total spend was CA$12,252 against the agency's CA$17,680. Conversions were close to level at 359 against 376, on 31% less spend. Put another way, the agency campaign bought 21.3 conversions for every CA$1,000 it spent and mine bought 29.3.

Most digital marketing portfolio pages would stop there. I want to be honest about the one number that did not improve: the raw conversion count was 4.6% lower. If the goal had been volume at any price, the agency campaign wins. The goal was cost per enrolment lead, and that is where the money went further.

Paired bar chart comparing the agency's Google Ads campaign with Justin Chapman's All Programs Search campaign: cost per conversion CA$46.98 versus CA$34.13, cost per click CA$4.70 versus CA$3.27, spend CA$17,680 versus CA$12,252, invalid clicks 427 versus 170, conversions 376.3 versus 359.0, clicks 3,762 versus 3,744, conversions per CA$1,000 of spend 21.3 versus 29.3 Agency campaign versus my All Programs Search campaign Google Ads, CanScribe Career College. Agency May to Jul 2026, mine Aug to mid-Oct 2026. Each row on its own scale. Agency campaign My campaign Cost per conversion CA$46.98 CA$34.13 -27.4% Average cost per click CA$4.70 CA$3.27 -30.4% Total spend CA$17,680 CA$12,252 -30.7% Invalid clicks 427 170 -60.2% Conversions 376.3 359.0 -4.6% Clicks 3,762 3,744 -0.5% Conversions per CA$1,000 21.3 29.3 +37.7%
Agency campaign (May to July 2026) versus my All Programs Search campaign (August to mid-October 2026), Google Ads. Pink is the agency, navy is mine. Each row is scaled independently, so compare bars within a row, not across rows. Conversions per CA$1,000 is calculated from the conversions and cost columns.
Google Ads campaign table for CanScribe Career College comparing the agency campaign with Justin Chapman's All Programs Search campaign, showing CA$34.13 cost per conversion against CA$46.98
The Google Ads campaign table the chart above is built from.

CanScribe on Facebook: 90 days, no ad budget

I ran a 90-day push on CanScribe's Facebook page with one goal, more interactions and more followers, and one constraint, no ad spend. Page visits came in at 1.6K, up 20.8% on the previous 90 days, and follows were up 8.3% to 52. Not a fireworks number. It is the kind of steady organic lift that makes the paid campaigns cheaper later, because warm audiences cost less to reach.

1.6KFacebook page visitsUp 20.8% on the previous 90 days
52New followsUp 8.3% on the previous 90 days
$0Ad spend
Meta insights for the CanScribe Career College Facebook page showing 1.6K visits up 20.8% and 52 follows up 8.3% over 90 days with no ad spend
CanScribe Facebook page visits and follows, Jul 18 to Oct 15, no ad spend.

The retargeting video campaign

Separately, I ran a video campaign retargeting people who had already visited the CanScribe site. Three-second views nearly doubled at 96.6%, watch time was up 92.9% to one day and five hours, and total views were up 11.4% to 176.5K. Content interactions were flat, down 0.5%. I am leaving that number in. A digital marketing portfolio with nothing flat in it is not a real one.

Bar chart of CanScribe retargeting video campaign results versus the previous period: 3-second views up 96.6% to 6.3K, watch time up 92.9% to one day five hours, views up 11.4% to 176.5K, content interactions down 0.5% to 365 Retargeting video campaign versus the previous period Meta content overview, CanScribe Career College, Jul 18 to Oct 15 0% 3-second views +96.6% (6.3K) Watch time +92.9% (1d 5h) Views +11.4% (176.5K) Content interactions -0.5% (365)
CanScribe retargeting video campaign versus the previous period, Meta. The one flat metric is shown in pink.
Meta content overview for CanScribe Career College showing 176.5K views up 11.4%, 6.3K 3-second views up 96.6%, 365 content interactions down 0.5% and 1 day 5 hours of watch time up 92.9%
Meta content overview for CanScribe, Jul 18 to Oct 15.

Earlier results: Focus College, CanScribe and agency clients

The screenshots above are recent. The numbers below are older and I no longer have access to the dashboards they came from, so take them as reported results rather than screenshots.

Focus College, 2024 to 2025

Focus College brought me in on contract with no CRM, no conversion tracking, and ad campaigns that were burning money. I implemented Keap from scratch, rebuilt the workflows, set up conversion tracking, and ran Google Ads, Meta and in-store app advertising. Over the contract, cost per conversion fell 73.8% and leads were up 121.5%. The email list went from a 5.4% open rate to 32.2%, and the click rate went from 0.5% to 2.4%.

-73.8%Cost per conversionGoogle Ads and Meta, Focus College
+121.5%Leads
Paired bar chart of Focus College email performance before and after: open rate 5.4% to 32.2%, click rate 0.5% to 2.4% Focus College email performance, before and after Keap, 2024 to 2025 contract. Rates are percentages. Before After Email open rate 5.4% 32.2% +26.8 pts Email click rate 0.5% 2.4% +1.9 pts
Focus College email performance before and after the Keap rebuild. Changes shown in percentage points.

CanScribe Career College, 2016 to 2020

As Vice-President I rebuilt the full marketing and admissions funnel. The connection rate went from 10.2% to 41.4%, the conversion rate from 8.33% to 11.5%, and the sales cycle from 3.2 months to 1.8. Lead generation was up 31.1% on a flat budget, cost per conversion was down 62%, and fraudulent clicks were down 70% after I put ClickCease in place.

Paired bar chart of the CanScribe admissions funnel before and after, 2016 to 2020: connection rate 10.2% to 41.4%, conversion rate 8.33% to 11.5%, email open rate 12.11% to 42.87% CanScribe admissions funnel, 2016 to 2020 Before and after rebuilding the marketing and admissions funnel. Rates are percentages. Before After Connection rate 10.2% 41.4% +31.2 pts Conversion rate 8.33% 11.5% +3.2 pts Email open rate 12.11% 42.87% +30.8 pts
CanScribe admissions funnel before and after, 2016 to 2020. Changes shown in percentage points.
3.2 to 1.8Months in the sales cycleCanScribe, 2016 to 2020
+31.1%Lead generationOn a flat budget
-62%Cost per conversion
-70%Fraudulent clicks

Chapman Digital Marketing clients

Through Chapman Digital Marketing I have done the same work for a construction company in Calgary, a caterer in the Lower Mainland, and a charity in the UK. Different industries, same method: tracking first, then the ads, then read the numbers and adjust.

+70%Conversion rateChapco Construction, Calgary
-25%Advertising costsChapco Construction, Calgary
+33%Catering inquiries in 3 monthsThe Yoga Chef, Lower Mainland
+122%Donations over 6 monthsSmart CJS, UK charity
-84%Onboarding costsSmart CJS, UK charity

What this digital marketing portfolio has in common

None of these campaigns had a big budget. The Reddit campaign, the council campaign and the CanScribe Facebook push were all run by one person with tracking set up properly, ads written for a specific audience, and a landing page that matched the ad. The expensive part of marketing is usually not the media spend. It is the months of spend that nobody was measuring.

If you want to see how I built The Trade Analyzer without being a developer, that story is here. If you want to talk about your own campaigns, get in touch.

Learn more about this guy

Explore More Experience

From years of volunteering and coaching to leadership and administrative experience. Justin Chapman is working to make his community a better place for his family and yours.